
Solutions · Focus Where It Pays Off
A sharper lens on where the margin actually is.
You carry thousands of SKUs — a second set of eyes points you at the few that move the needle. Margin, velocity, and cost in one view, so attention goes where it pays off most.
Margin visibility at the item level — by cost, retail, and velocity together.
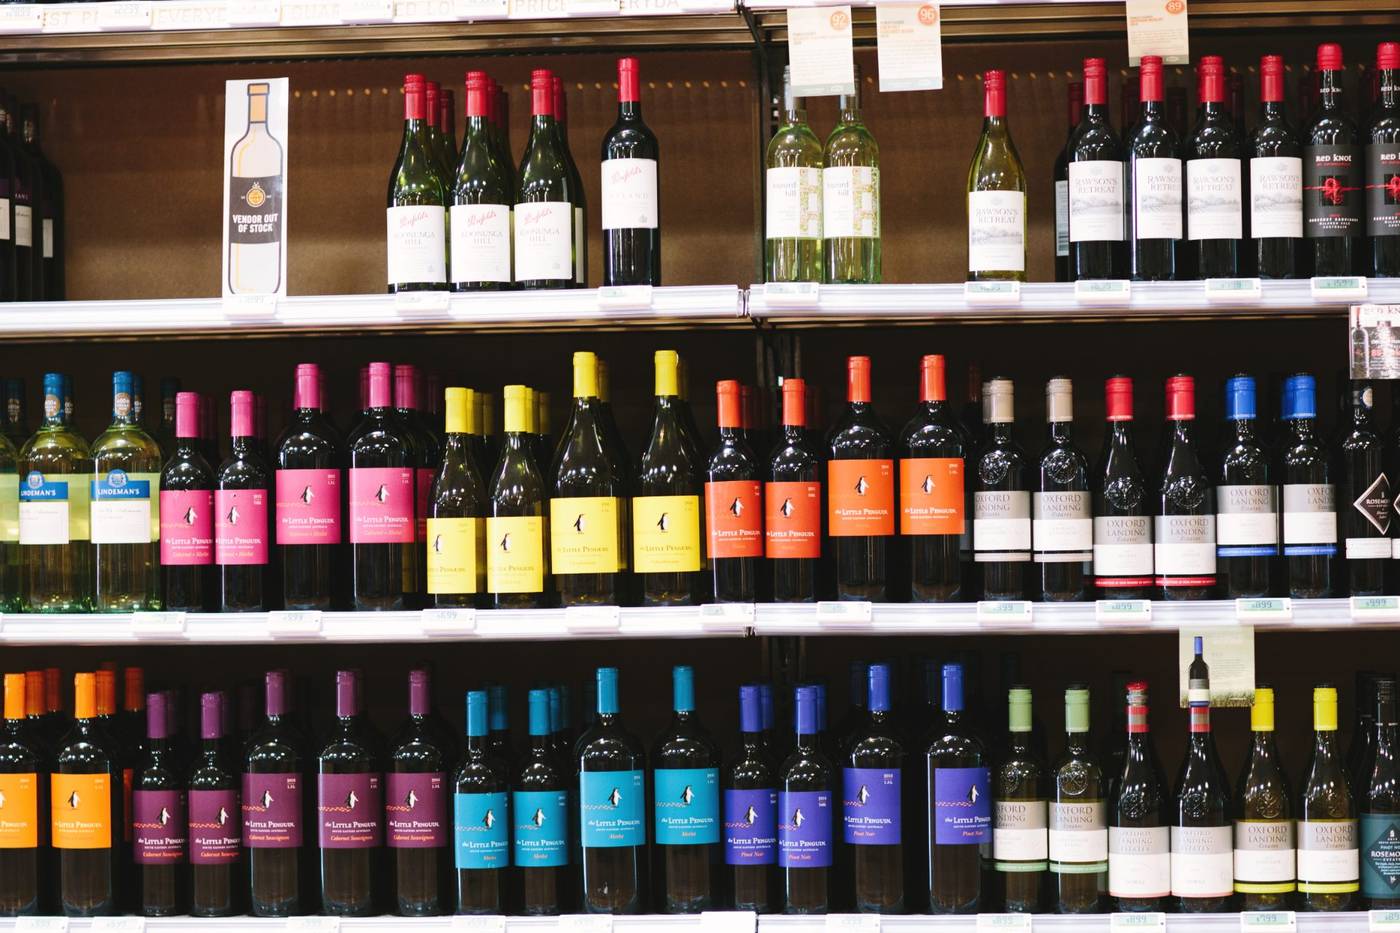
Where attention pays off most
Across thousands of SKUs, a handful carry most of the weight.
In a full-range beer, wine, and spirits store, the items that earn the most and the items that sell the most aren’t always the same list. Margin at the item level — what a SKU actually keeps at current cost and current retail — takes some looking to find without a tool built for it.
When a supplier raises a cost and retail doesn’t follow, the gap is small per bottle and easy to miss until it accumulates. The same goes for items that have been reordered out of habit rather than velocity.
You decide where to focus. We make sure the view is there when you need it.
What slips out of view
- Cost goes up — retail doesn’t follow
- No SKU-level view of what’s actually earning vs. what’s moving
- Cash tied up in slow movers that don’t surface on their own
- Margin impact of a price change only visible after the fact
How mPower helps
Know which items carry your profit — and which are quietly costing you.
About one SKU in ten drives 80% of gross profit — and nearly half the catalog hasn’t sold in the last 12 months. mPower’s Catalog Health gives you both views: the earners to protect and the dead stock to stop reordering.
Margin at the item level — not a category average
Every SKU carries its own cost, retail, and margin at the current moment. The items earning the most and the items earning the least are visible on the same screen, ranked by what they actually keep — by item, category, vendor, and location.
Auto-classified by margin and velocity: Star, Workhorse, Puzzle, Dog
Every item lands in a quadrant based on how much it earns crossed with how fast it moves. A Star sells fast and earns well; a Dog moves slow and earns little. The classification runs automatically from your live sales data — no spreadsheet, always current.
Up to half the catalog can be dead stock — cash sitting idle on the shelf
Items with no sale in 12 months are their own category in mPower: Dead. They don’t surface in a normal item list, but they appear here with the inventory value sitting idle in each one. That’s the first step to redirecting that cash toward the earners.
Margin violations on your top earners float to the top
When a vendor cost rises and an A-tier item drifts below your margin floor, the tier-aware Margin Shield surfaces it — sorted by which items carry the most weight, not alphabetically or by department. The items that matter most get flagged first.
See the margin impact before a price change goes out — not after
Before a retail change is approved, its margin effect is visible in the same workflow. Change 30 items at once, see the weighted impact across all of them, and set prices with the numbers already done. No after-the-fact discovery that you gave margin away.
Ask your store data a question in plain English — the answer is immediate
Type the question the way you’d say it — “what were my top 20 items last month by gross profit?” — and get the answer in seconds from live data, without building a report or writing a query.

Shared Navigation
The numbers you act on should be the numbers you can trust.
Margin decisions are only as good as the data behind them. mPower keeps cost, inventory, and pricing in sync — so when you look at what’s earning, the math is already done and the underlying counts are current.
That’s what “shared navigation” means in practice: a second set of eyes on the numbers, so yours can stay on the store.

Proven across the category
Trusted by independent operators across 46 states + DC.
Built only for beer, wine & spirits — the category is already understood.
Keep going
Margin focus is one part of the picture.
Related solutions
Set It Once, Trust It Everywhere
Write the rule once, in plain English — it keeps the right stock on the shelf, catches the exceptions, and holds your margins at every store.
ExploreStay Ahead of the Shelf
Never run out of the items that make your money — reordered before they hit zero, with surplus pulled from another store first.
ExploreGet Your Week Back
Drop the whole invoice stack — mPower splits it, matches every line to your POs, and catches what’s wrong before you pay.
ExploreRun Every Store Like One
Your stores buy together and cover each other — one purchase request, the leverage of a bigger operator.
ExploreThe product behind it
See where your
margin concentrates.
A consultative walkthrough of mPower’s profitability and analytics tools — with a real person who knows beverage retail.
Schedule a Demo